A speed test measures how much data gets through in ten seconds. A conversation needs small packets to arrive every 20 milliseconds, in order, with no gaps. Those are two different properties of the same link, and the second cannot be inferred from the first.
Throughput measures capacity
A speed test opens several connections, fills the link and counts what gets through. It gives a peak capacity, useful to check a subscription or download a file. It says nothing about what happens between two packets.
A link can carry 100 Mbps on average while stalling for 200 milliseconds every three seconds. The file still arrives; the conversation does not.
Voice depends on regularity
A voice stream sends a packet of a few dozen bytes every 20 ms. The receiver plays them back at a fixed rate. If a packet arrives late, it is discarded; if it is missing, the codec fills the gap. Beyond a few percent of lost or late packets, voice becomes choppy or metallic.
Video calls add pictures: more throughput, but the same demand for regularity. That is why “video keeps cutting out” rarely has a lack of throughput as its cause.
Latency, jitter, loss, micro-outages
Latency is the round-trip time; beyond 150 to 200 ms, conversation becomes laborious. Jitter is the variation of that latency; it is what fills or empties the receiver's buffer. Loss is the packets that never arrive. Micro-outages are interruptions of a few hundred milliseconds, too short for a bar graph, long enough to cut a word.
Jitter that is already high at rest tells of a link that is unstable by nature. Jitter that appears only under load tells of saturation. The two are fixed differently.
The example: 503 Mbps for a voice score of 52/100
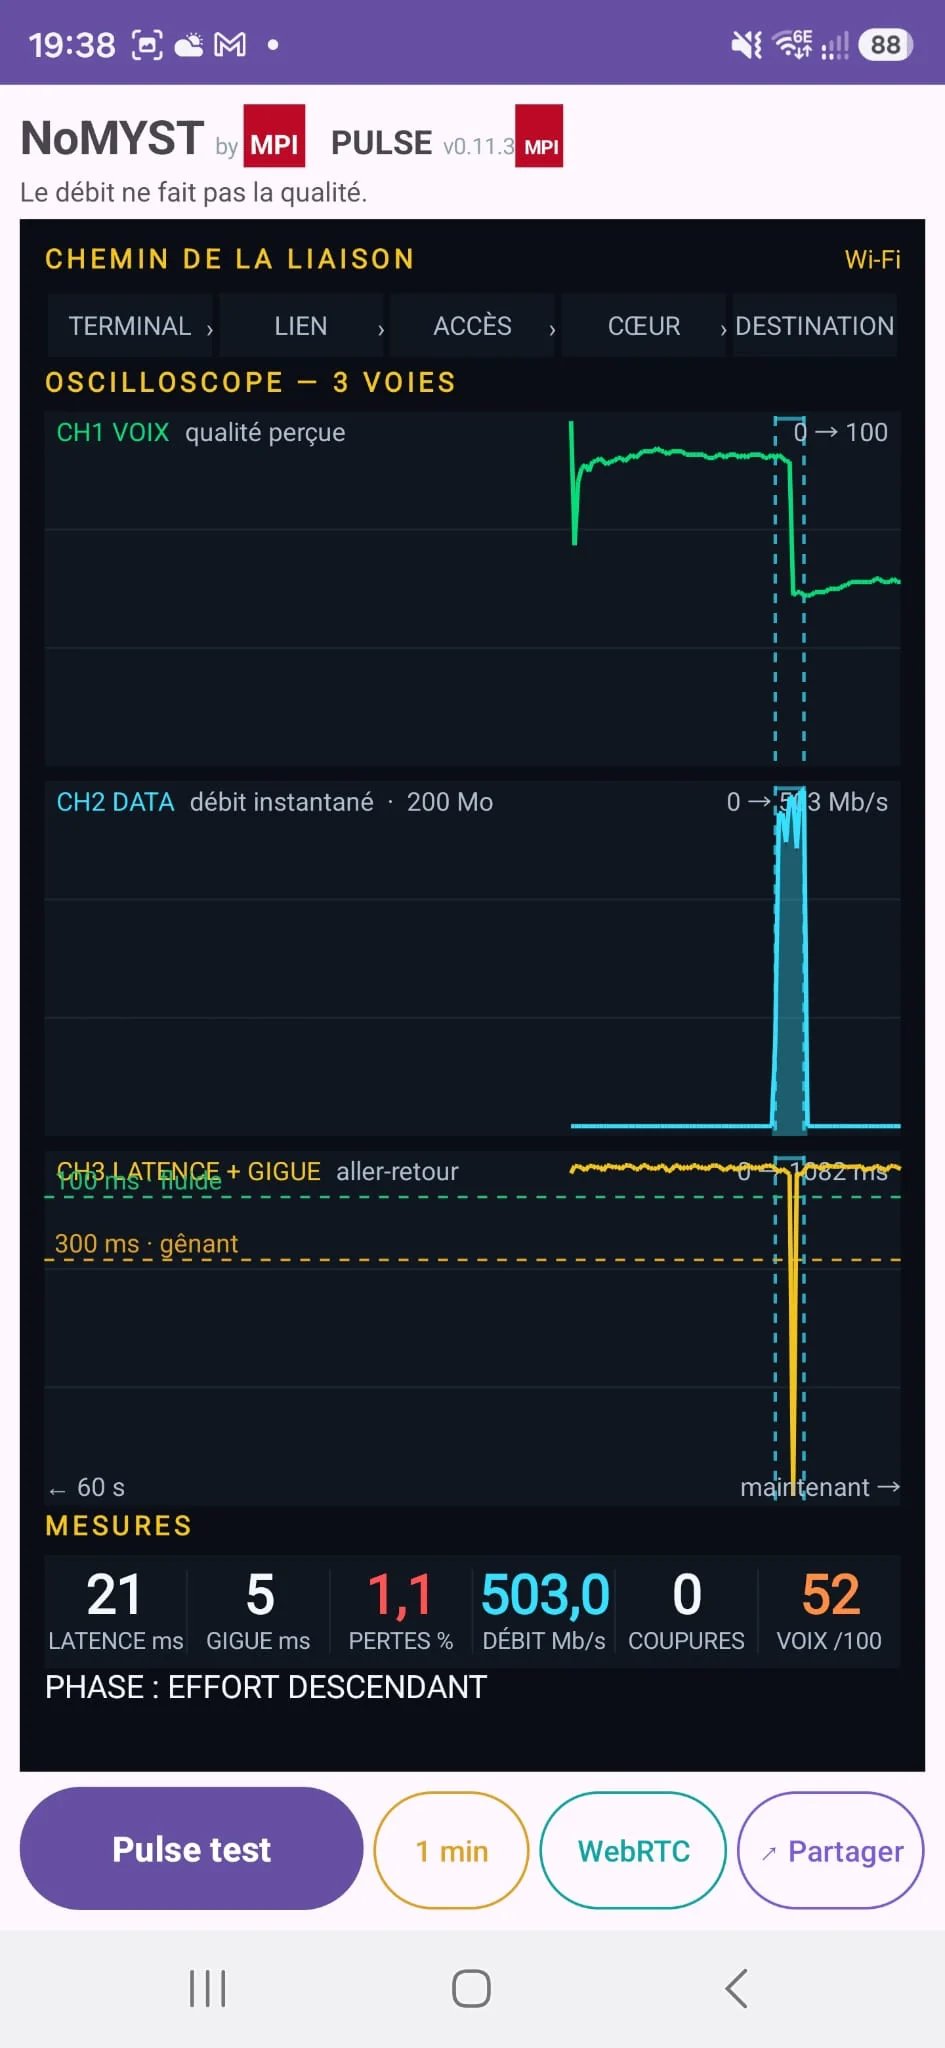
On a real Pulse measurement, the link reached 503 Mbps during the transfer. At the same moment, the computed voice quality fell to 52/100 and latency became very irregular. Pulse indicated saturation as the probable cause: the link had capacity, but transfer traffic was taking precedence over voice packets.
In another case, the link showed 2.2% loss at rest, before any load. No speed test would have shown it; the cause was a Wi-Fi printer on the access point's channel.
What Pulse does differently from a speed test
Pulse observes the link at rest, then provokes a ramp-up, sustains the load, and returns to rest. In each phase it plots voice quality, traffic and latency with its jitter on the same time axis. The symptom appears at a precise moment; that moment guides the diagnosis.
The summary separates the observation, the probable cause and the check to perform. If the data does not allow a conclusion, Pulse says so.
A NoMYST example